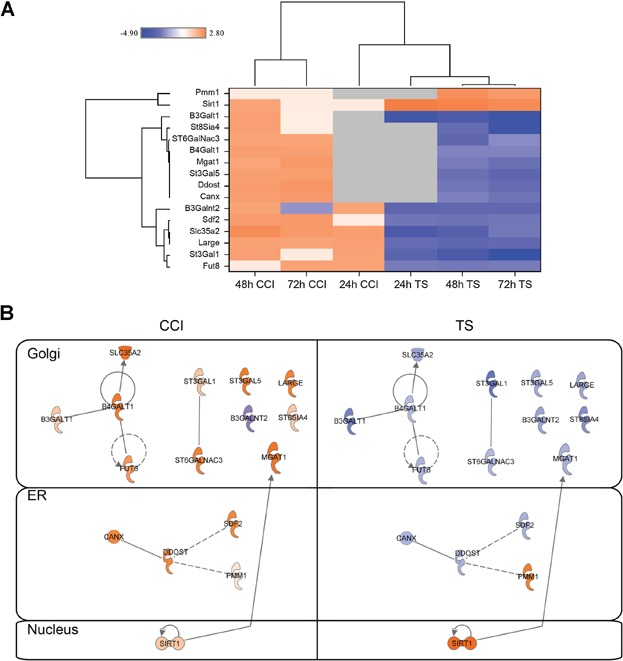
Figure 7.

The changes of genes involved in N-linked glycosylation at the mRNA level. Cells were collected from the production bioreactor cultures at each indicated time point (24, 48, and 72 h). Total RNA was isolated and subjected to microarray analysis as described in Materials and Methods section. All measurements are relative to control at each time point. Genes were selected for this analysis if their expression levels deviated from the control by at least a fold change of ±2. Designated P-value cutoffs were used to compile lists of significantly changed genes used for downstream pathway analysis. The color scale ranges from saturated blue for log2 ratios −4.0 and below to saturated orange for log ratios 2.80 and above. Each gene is represented by a single row of colored boxes; each time point is represented by a single column. (A) The sequence-verified named genes in these clusters involved in N-linked glycosylation. (B) A comparison of interactions and cellular localizations of key differentially regulated N-linked glycosylation proteins. Direct interactions are shown with solid edges while indirect interactions are represented with dashed edges.
