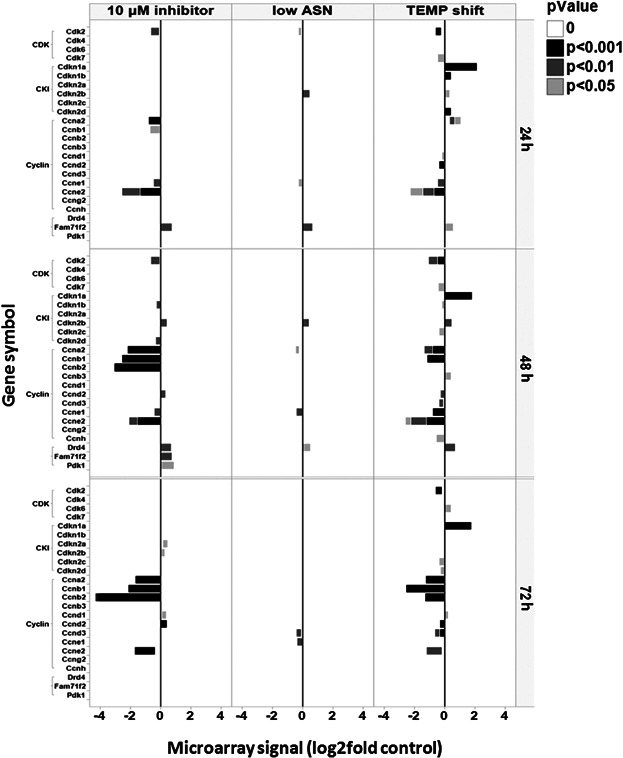
Figure 8.

Expression changes of genes involved in the cell cycle pathway at the mRNA level. Cells with the treatment of CCI, low Asn, and 33°C-temperature shift were collected from the production bioreactors at each indicated time point (24, 48, and 72 h). Total RNA was isolated and subjected to microarray analysis as described in Materials and Methods section. Genes involved in the cell cycle pathway are shown. Values represent the fold changes in expression levels. Different color shades indicate significant (P < 0.001, P < 0.01, P < 0.05) changes in all conditions represented.
