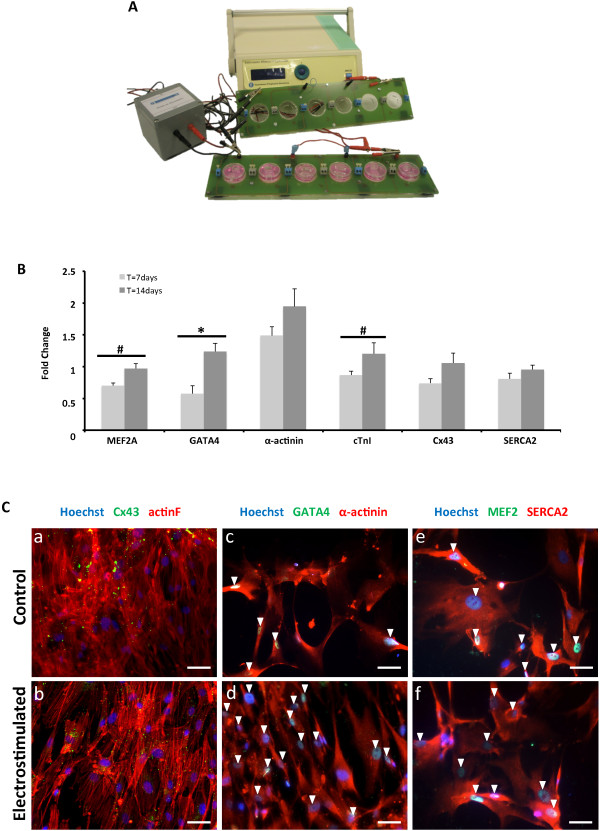
Figure 2.

Genetic and protein analysis after electrical stimulation. (A) Experimental setup for electric stimulation: the electric stimulator is connected to the printed circuit boards through an isolator stage. (B) Real-time RT-PCR of cardiac genes in electrically stimulated CMPCs, as compared with control, at 7 and 14 days. All RT-PCR values were analyzed in duplicate, normalized to GAPDH expression, and shown as fold-change mean ± SEM; *P < 0.05 and #P < 0.10, 7-day (n = 5) versus 14-day (n = 10) stimulation. (C) Actin fibers (red) and Cx43 (green), sarcomeric α-actinin (red) and GATA4 (green), and SERCA2 (red) and MEF2 (green) expressions in control (a, c, e) and electrostimulated (b, d, f) CMPCs, respectively. Nuclei were counterstained with Hoechst 33342. Scale bars = 50 μm. Arrowheads, positive staining of nuclear proteins (MEF2 and GATA4).
