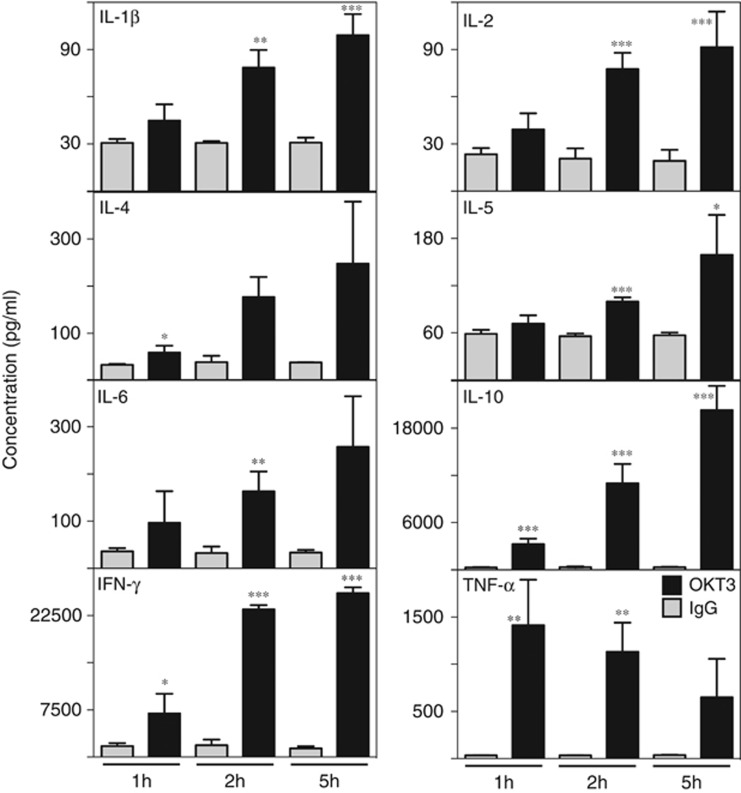
Figure 4.
Induction of cytokines after injection of OKT3. Hu-SCID mice were injected with 10 μg OKT3 (black bars) or IgG control (gray bars) IP. Mice were bled at 1, 2 and 5 h and circulating cytokine concentrations measured. Sensitivity (limit of detection) of analytes was 1 ng ml−1. The number of mice for each group was 4–5 and data are presented as mean+s.d. *P<0.05, **P<0.01, ***P<0.001 compared with controls at the same time point.

