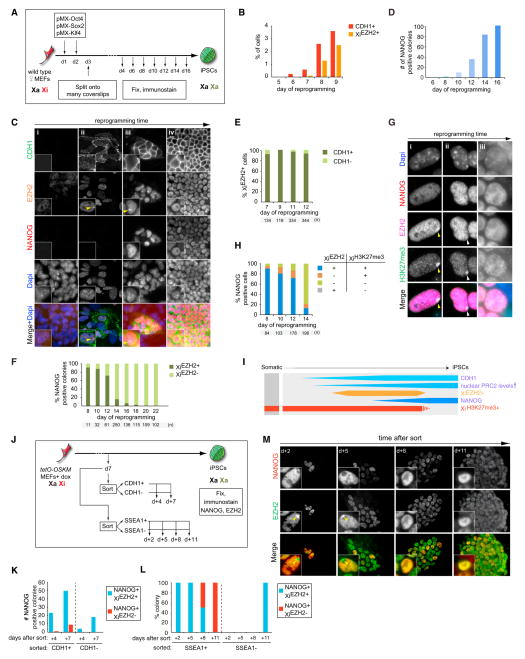
Figure 1. Time Course Analysis of XiEZH2+ during Reprograming to Pluripotency.
(A) Diagram of reprogramming time course experiments. In all experiments, results for female cells are displayed except when stated otherwise, and the time points and number (n) of cells or colonies counted are given in each subfigure.
(B) Quantitation of the proportion of CDH1+ or XiEZH2+ cells at indicated reprogramming time points. 100 cells in three randomly chosen microscopic fields were counted per time point.
(C) Multicolor immunostaining for CDH1 (green in merge), EZH2 (orange), and NANOG (red) at different stages of reprogramming. Dapi staining (blue) marks nuclei. Unlike MEFs (i), cells with elevated nuclear levels of EZH2 and XiEZH2+ (arrowhead) are seen within CDH1+ cells during reprogramming starting around day 7 of reprogramming (ii). (iii) NANOG+ colonies are first marked by XiEZH2+ and elevated EZH2 levels in the nucleus (image from day 9). (iv) Later, NANOG+ colonies become larger and are characterized by high nuclear EZH2 levels without XiEZH2+ (image from day 14).
(D) Number of NANOG+ colonies throughout reprogramming (a colony is defined as four or more closely localized cells).
(E) Proportion of XiEZH2+ cells with and without CDH1 expression during reprogramming.
(F) Proportion of NANOG+ colonies with or without XiEZH2+ at indicated time points. All NANOG+ colonies present in the reprogramming cultures were counted up to day 14 and only a subset thereafter.
(G) Multicolor immunostaining for EZH2 (magenta in merge) and NANOG (red) in combination with H3K27me3 (green). The images depict various states of XiEZH2+ and XiH3K27me3+ in NANOG+ cells quantified in (H). During reprogramming, (i) NANOG+/XiEZH2+ cells are initially XiH3K27me3+ (ii) and, at a later time point, become XiEZH2−/XiH3K27me3+ for a very short time and subsequently become (iii) XiEZH2−/XiH3K27me3−. Yellow and white arrowheads indicate XiEZH2+/XiH3K27me3+ and XiEZH2−/XiH3K27me3+ patterns, respectively.
(H) Quantitation of the immunostaining experiment in (G), giving the proportion of NANOG+ cells with XiEZH2+ or XiH3K27me3+ at indicated time points.
(I) Summary of Xi and global dynamics of PRC2 and H3K27me3 during reprogramming, relative to CHD1 and NANOG expression. Female-specific features are shown in orange/red, and those occurring in both female and male reprogramming are shown in blue. The width of the boxes represents the level of the epigenetic mark considered.
(J) Experimental design for the isolation and characterization of CDH1+/− or SSEA1+/− reprogramming subpopulations.
(K) Number of NANOG+ colonies with or without XiEZH2+ in CDH1+ and CDH1− sorted cell populations isolated as shown in (J), at indicated days after replating.
(L) Proportion of NANOG+ colonies with or without XiEZH2+ in SSEA1+ and SSEA1− sorted cell populations isolated as shown in (J), at indicated days after replating. n = 6 for each SSEA1+ time point, and n = 1 for the SSEA1− count at +d11. Colonies appearing in SSEA1+ replated cells become larger throughout this time course as shown in (M).
(M) Visualization of XiEZH2+ changes in replated SSEA1+ reprogramming intermediates over time from the experiment shown in (J) and (L). Replated cells were immunostained for EZH2 (green in merge) and NANOG (red) at the indicated days. Note the increase in colony size and disappearance of XiEZH2+ (yellow arrowhead) with time in culture.
See also Figure S1.

