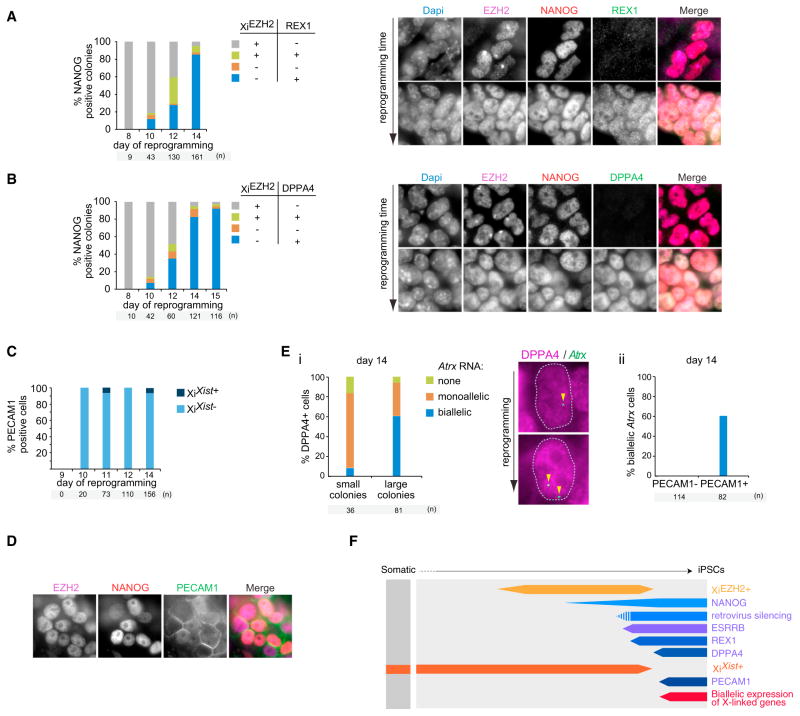
Figure 3. Xi Features in Relation to the Sequential Expression of Pluripotency Factors during Reprogramming.
(A) Quantitation of an immunostaining analysis of NANOG, XiEZH2+, and REX1, presenting the proportion of NANOG+ colonies with XiEZH2+ and/or REX1 expression at indicated time points. Right, representative immunostaining images for EZH2 (magenta in the merge), NANOG (red), and REX1 (green).
(B) As (A) for NANOG, XiEZH2+, and DPPA4.
(C) Quantitation of an immunoFISH analysis for PECAM1 and Xist RNA displaying the proportion of PECAM1+ cells with XiXist+.
(D) Representative immunostaining image for EZH2 (magenta in the merge), NANOG (red), and PECAM1 (green), demonstrating the absence of XiEZH2+ in PE-CAM1+ cells.
(E) (i) Quantitation of mono- and biallelic expression of the X-linked gene Atrx within cells of small (<12 cells) and large (>20 cells) DPPA4+ colonies and representative images from the DPPA4 (magenta) and Atrx (green) immunoFISH staining. Arrowheads indicate Atrx nascent transcription signals. (ii) Quantification of biallelic Atrx expression in PECAM1+/− cells.
(F) Summary of reprogramming stages identified in this figure as in Figure 2E.
See also Figure S3.

