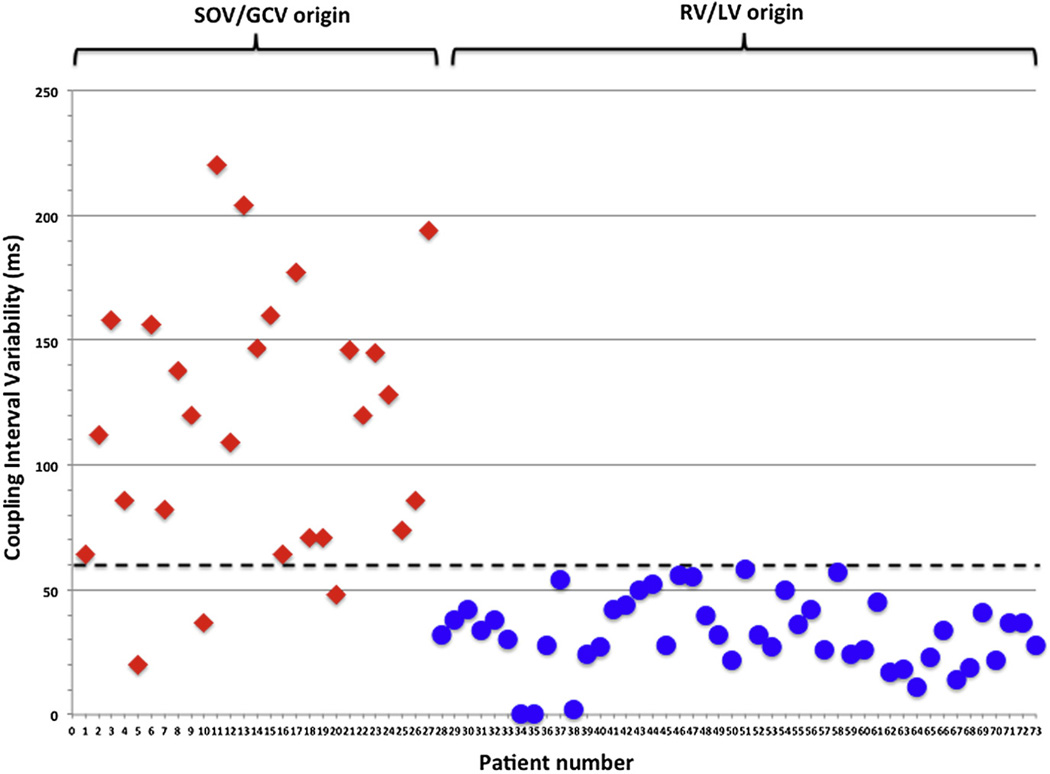
Figure 1. Scatter Plot of ΔCI Demonstrating Variable CI in PVCs Originating From the SOV/GCV But Not in PVCs From the RV/LV.
The scatter plot demonstrates that PVCs originating from the SOV/GCV predominantly have a ΔCI <60 ms, whereas RV/LV origin PVCs consistently have a ΔCI >60 ms with a ΔCI of <60 ms, demonstrating a sensitivity of 89%, specificity of 100%, positive predictive value of 100%, and negative predictive value of 94%. ΔCI = (maximum – minimum) coupling interval; PVC = premature ventricular complexes; RV/LV = right ventricle/left ventricle; SOV/GCV = sinus of Valsalva/great cardiac vein.

