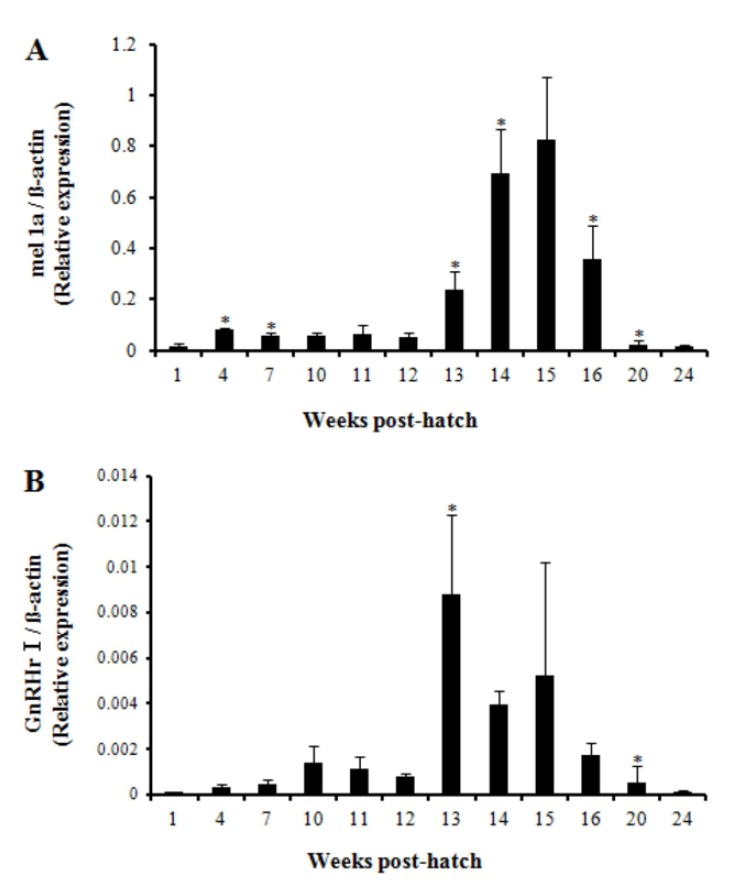
Fig. 5.

Relative expression pattern of mel 1a mRNA (A) and GnRHr I mRNA (B) in the brain of Nile tilapia from 1 wph to 24 wph. Differences in the mRNA levels were estimated by quantitative real-time PCR. The relative abundance of the mRNAs was normalized to the amount of β-actin mRNA by the comparative threshold cycle method. Each value represents mean ± SEM (n = 4). Asterisks (*) indicate significant difference from the immediately previous observation within this study (P<0.05).
