
Figure 5.
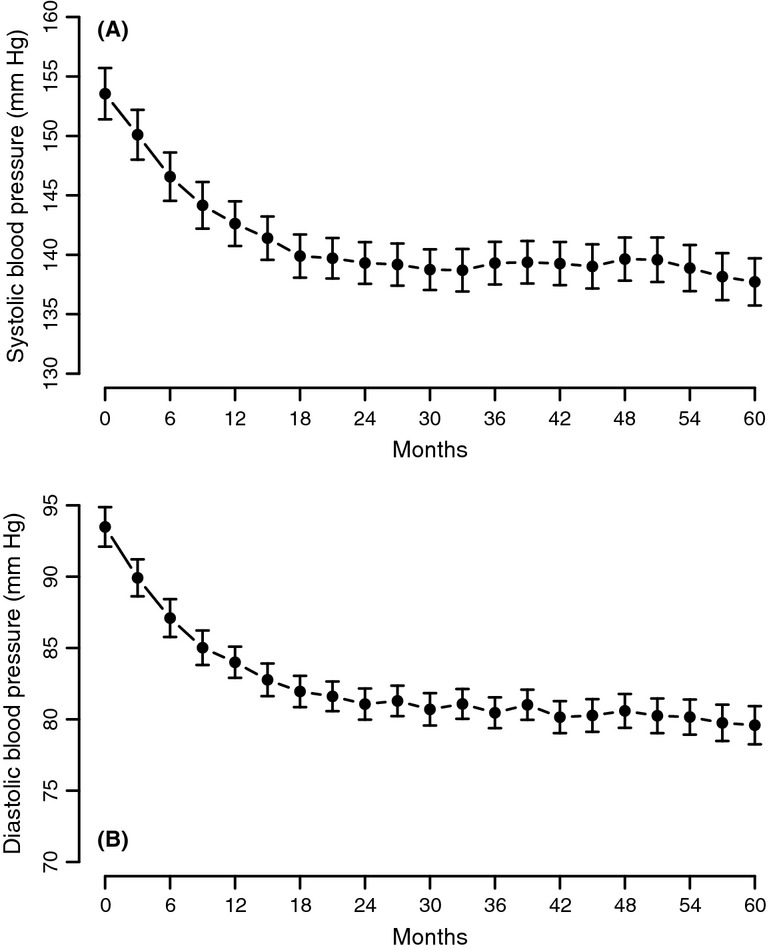
Systolic blood pressure (A) and diastolic blood pressure (B) in men with TD undergoing T therapy for 5 years
Official websites use .gov
A
.gov website belongs to an official
government organization in the United States.
Secure .gov websites use HTTPS
A lock (
) or https:// means you've safely
connected to the .gov website. Share sensitive
information only on official, secure websites.
Systolic blood pressure (A) and diastolic blood pressure (B) in men with TD undergoing T therapy for 5 years