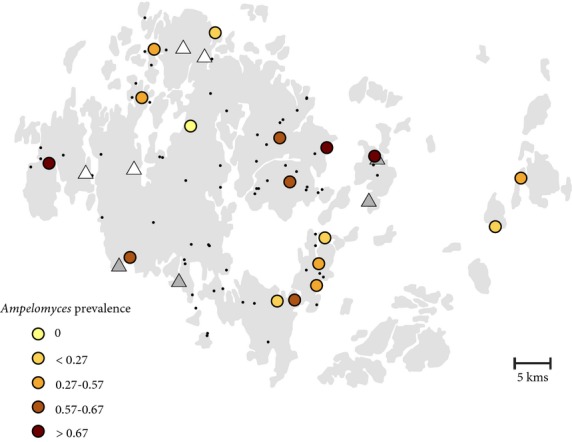
Fig 1.

Map of the study sites, indicating the location of (i) the initial observation of pycnidia in 2011 (four populations indicated with white triangles), (ii) the populations sampled in 2013 (four sites indicated with grey triangles), (iii) the populations having sufficient sample size (>22 samples) to estimate Ampelomyces prevalence (the colour gradient indicates the prevalence level) and (iv) all the sampled populations (black dots).
