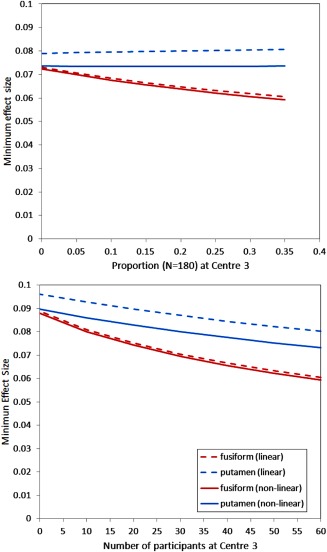
Figure 2.

Minimum observable effect size estimated from segmentations of DESPOT1 acquisitions in sub‐cortical and cortical brain regions with images registered to standard MNI space by linear and non‐linear mappings as a function of (a) the proportion of the total sample of 180 participants attending centre 3 and (b) holding the number of participants attending centres 1 and 2 constant and varying the number of participants attending centre 3.
