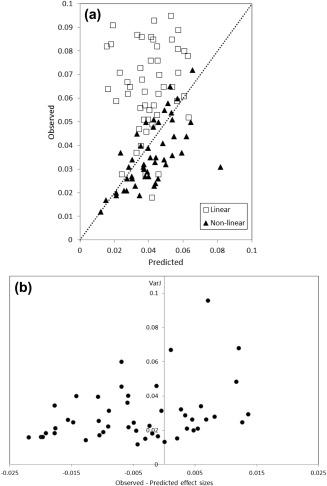
Figure 3.

(a) Predicted effect sizes from power calculations against those observed from MRC‐AIMS in clusters identified by a statistical threshold of α < 0.001 uncorrected on a between‐group test of the MRC‐AIMS dataset. Results from both linear and non‐linear registration techniques are displayed, as is the line of identity (i.e., prediction = observation). (b) The variance of the Jacobian determinant following non‐linear registration against the observed–predicted effect sizes for each cluster. An outlying point at predicted–observed effect size = −0.052 is omitted from the figure.
