
Figure 2.
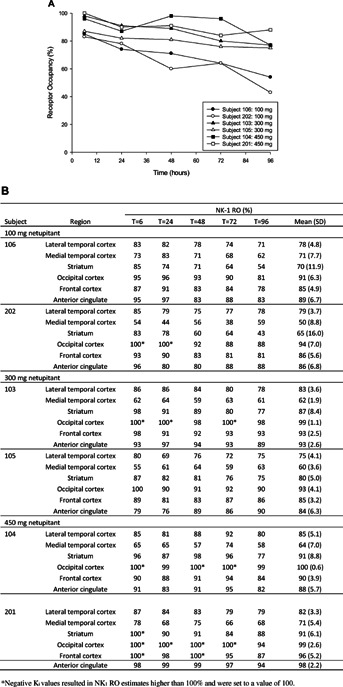
(A) Individual netupitant NK1 receptor occupancy (NK1-RO) in the striatum at different time and doses; (B) Individual netupitant NK1-RO in all tested brain regions at 6, 24, 48, 72, and 96 hours. Data are mean (SD), CV%.
Official websites use .gov
A
.gov website belongs to an official
government organization in the United States.
Secure .gov websites use HTTPS
A lock (
) or https:// means you've safely
connected to the .gov website. Share sensitive
information only on official, secure websites.
(A) Individual netupitant NK1 receptor occupancy (NK1-RO) in the striatum at different time and doses; (B) Individual netupitant NK1-RO in all tested brain regions at 6, 24, 48, 72, and 96 hours. Data are mean (SD), CV%.