
Figure 3.
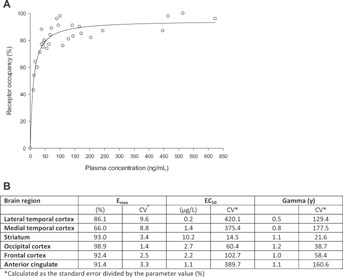
(A) Relationship between NK1 receptor occupancy (%) and netupitant plasma concentrations (PD/PK) in striatum at 6, 24, 48, 72, and 96 hours after administration of netupitant; (B) Summary of PK/PD variables estimated from the sigmoid Emax model in all brain regions.