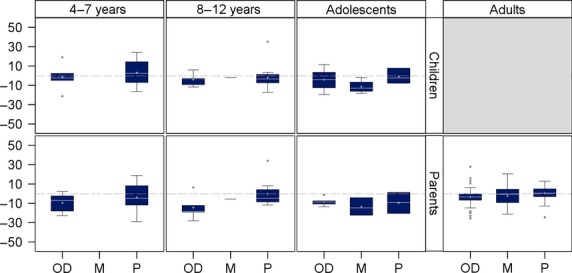
Fig 2.

Mean change in HAEMO-QOL total score for each version from baseline to end-of-treatment, according to the type of regimen patients received within the 12 months preceding the trial. A negative change in HAEMO-QOL total score indicates improved HRQoL. (OD: on-demand/M: mixed regimen/P: prophylaxis). Box plots present the following: interquartile range (Q1–Q3); +: mean; −: median; bottom and top bars: observed minimum and maximum observed values; ○: outliers (i.e. values that are outside the distance of 1.5 times the interquartile range from Q1 or Q3).
