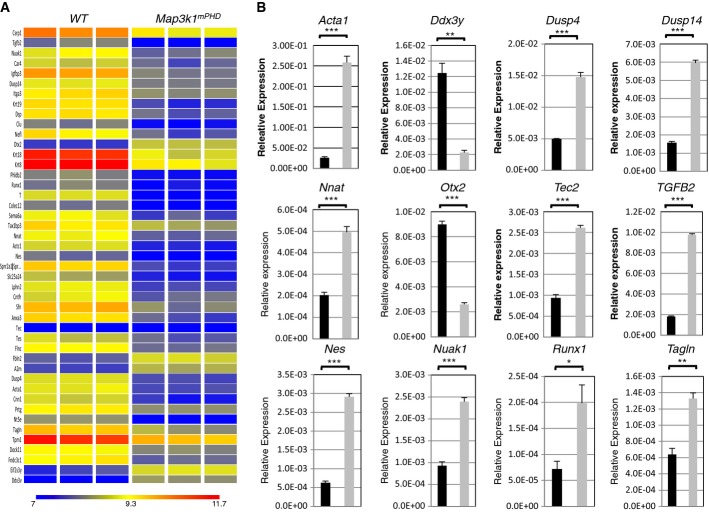
Figure 6. Altered gene expression in Map3k1mPHD ES cells.
- Heat map showing differential gene expression between pluripotent WT and Map3k1mPHD ES cells.
- Confirmation of selected microarray hits by real-time PCR. (
 ) WT and (
 ) Map3k1mPHD ES cells RNAs were analysed by real-time PCR. The average relative expression (± SEM) of the indicated mRNA from three independent experiments was statistically analysed, where appropriate, by two-tailed Student's t-test (*P ≤ 0.05; **P ≤ 0.01; ***P ≤ 0.001).
Source data are available online for this figure.

