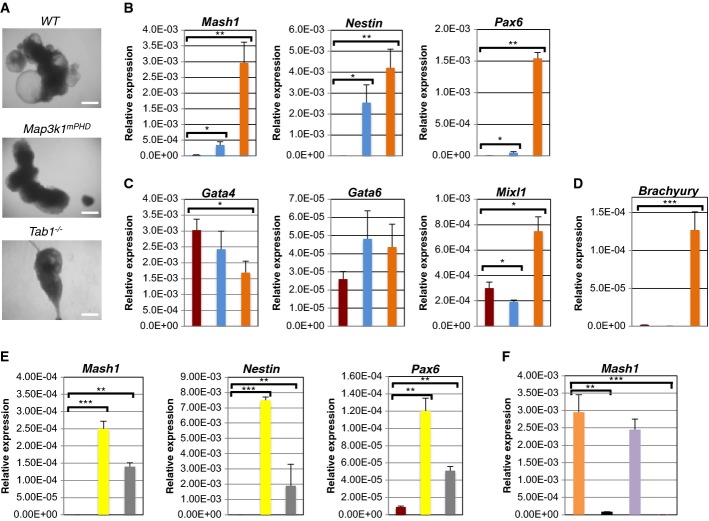
Figure 7. Map3k1mPHD ES cells exhibit an altered differentiation pattern.
WT, Map3k1mPHD and Tab1−/− ES cells were plated under differentiation conditions without LIF for 6 or 9 days.
A Pictures of EBs were taken using an Olympus light microscope after 9 days of differentiation and analysed using Image Pro-Software at 40× magnification. Scale bar is 250 μm.
B–D ( ) WT, (
 ) Map3k1mPHD and (
 ) Tab1−/− ES cells were plated under differentiation conditions for 6 days, and their RNAs analysed by real-time PCR with primers specific for (B) neuroectoderm, (C) endoderm and (D) mesoderm genes.
E WT ES cells were differentiated for 6 days in the presence of ( ) DMSO, (
 ) SB203580 or (
 ) SB431542, and their RNAs analysed by real-time PCR with primers specific for neuroectoderm genes.
F Tab1−/− ES cells were transfected with ( ) CMV, (
 ) CMV TAB1 or (
 ) CMV mTAB1 and used alongside (
 ) WT ES cells in differentiation assays for 6 days, mRNA was extracted and their RNAs analysed by real-time PCR with primers specific for the neuroectoderm gene Mash1.
Data information: The average relative expression (± SEM) of the indicated gene mRNA from three independent experiments was statistically analysed, where appropriate, by two-tailed Student's t-test (*P ≤ 0.05; **P ≤ 0.01; ***P ≤ 0.001).
Source data are available online for this figure.

