
Figure 2. Epigenetic instability of Bu-1a is dependent on the +3.5 G4 motif.
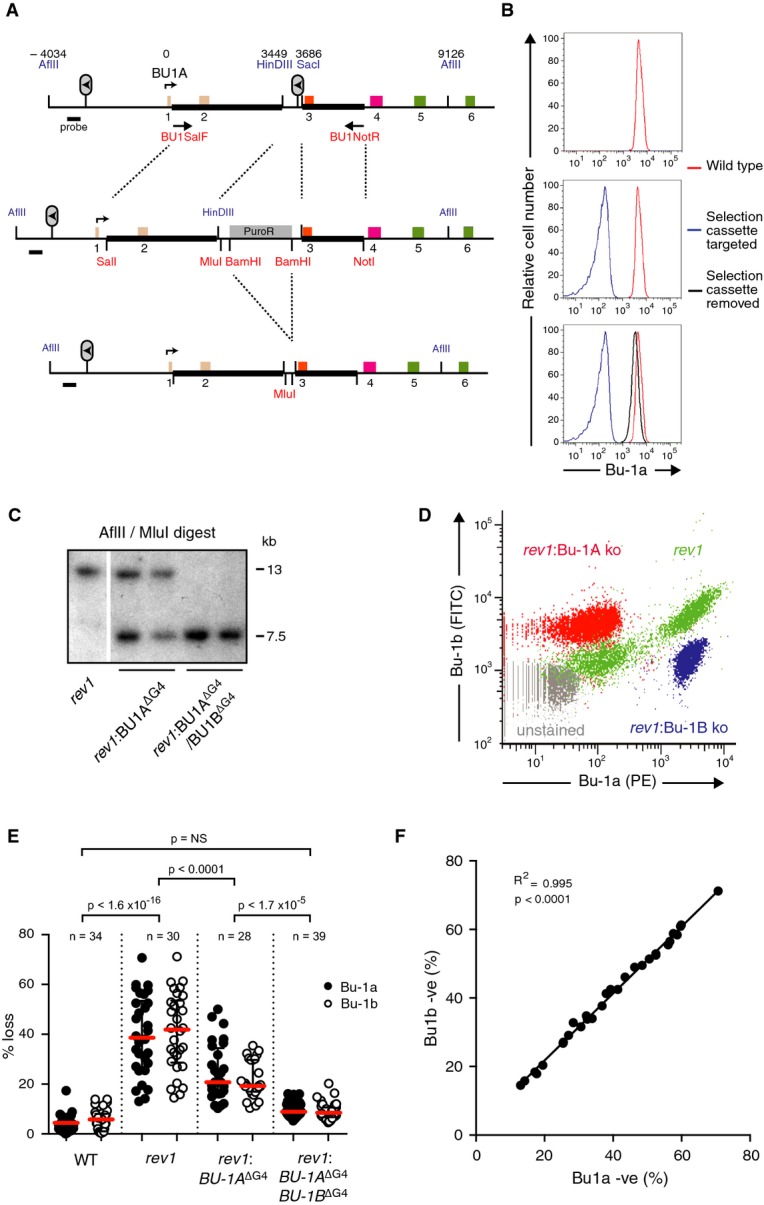
- Gene targeting strategy used to delete or replace the +3.5 G4 motif of the BU-1 locus. The six exons are colour-coded according to the domains of the protein shown in Fig 1A. BU1SalF and BU1NotR are the primers used to amplify the genomic region used in the construct (thick black bars). Restriction sites introduced into the construct are shown in red, and endogenous sites of importance are shown in blue. Numbers above the map indicate the position of key features, relative to the transcriptional start site.
- Bu-1a expression at the three stages of targeting shown in (A).
- Confirmation of targeting of the BU-1A and BU-1B alleles by Southern blotting. Sizes of genomic fragments for the endogenous locus in the rev1 background and the disrupted locus are shown.
- Correlation of loss of Bu-1a and Bu-1b expression in rev1 cells (green) compared with the effect of genetic abrogation of expression of Bu-1a (red) and Bu-1b (blue). Unstained cells in grey.
- Fluctuation analysis showing loss of Bu-1a and Bu-1b expression after deletion of the +3.5 G4 motif on the BU-1A allele and after its deletion from both BU-1A and BU-1B. Red bar = median loss; whiskers = interquartile range; P-values for compared Bu-1a loss distributions calculated with Fisher's exact test with a bin size of 20%.
- Correlation of the percentage of Bu-1a and Bu-1b loss variants in individual rev1 clones.