. 2014 Sep 4;33(21):2507–2520. doi: 10.15252/embj.201488398

Figure 4. Biophysical characterisation of the library of G4 motifs.

Figure 4

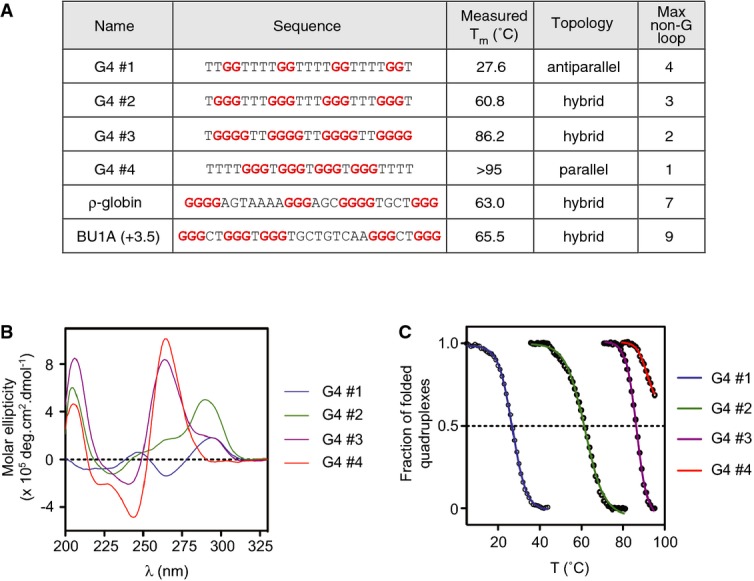
  1. Summary data table. G4#1–4 are model G4 motifs designed to have a range of melting temperatures. The in vitro topology was determined by circular dichroism in the presence of K+, shown in (B), and melting temperature is derived from the UV melting curves shown in (C).
  2. Circular dichroism spectra for G4#1–4 in K+. CD spectra for the ρ-globin and Bu-1a G4 DNAs have been determined previously (Barski et al, 2007; Sarkies et al, 2010, 2012).
  3. UV melting curves of G4#1–4. The Tm for the ρ-globin and Bu-1a G4 DNAs have been determined previously (Sarkies et al, 2010, 2012).