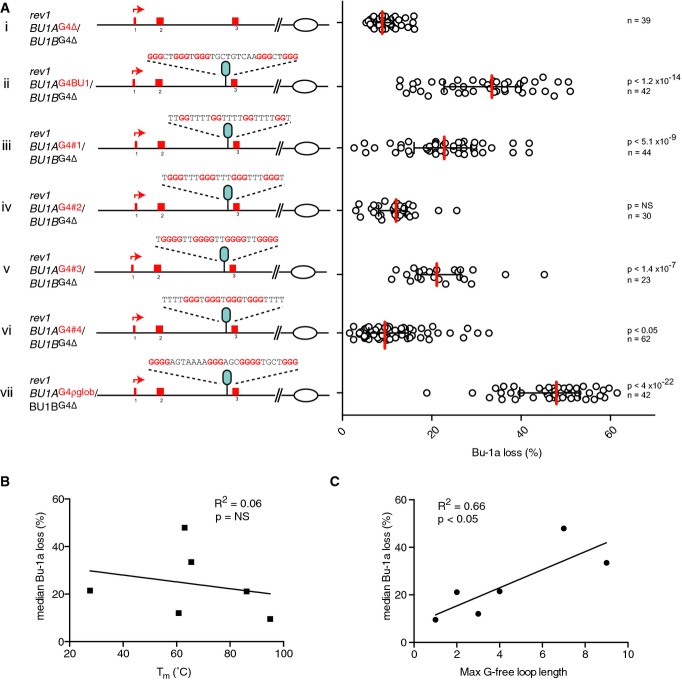
Bu-1a loss in mutants harbouring different G4 motifs at +3.5 kb from the TSS. (i)
rev1 cells with the G4 DNAs removed from both the
BU-1A and
BU-1B alleles. (ii) Knock-in of the wild-type +3.5 Bu-1 G4 motif. (iii–vi) Knock-ins of G4#1–4. (vii) Knock-in of the ρ-globin intron 2 G4 motif (Sarkies
et al,
2010). Red bar = median loss; whiskers = interquartile range;
P-values that each distribution is different from control (i) calculated with Fisher's exact test with a bin size of 20%. NS = not significant (
P < 0.001).

