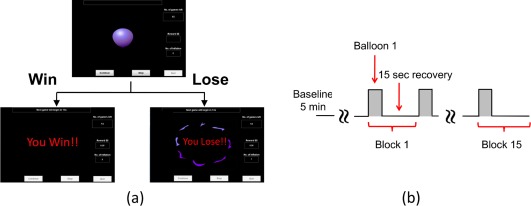
Figure 2.

BART risk task paradigm and protocol for fNIRS. (a) Visualization of BART outcomes from active or passive decision‐making modes. When balloon inflations are stopped, money is collected, and participant sees “You Win!” When balloon explodes, money is lost, and participant sees “You Lose!!” (b) Diagram showing 15 task blocks. Each block includes a 5‐s activation period and 15‐s recovery time. [Color figure can be viewed in the online issue, which is available at http://wileyonlinelibrary.com.]
