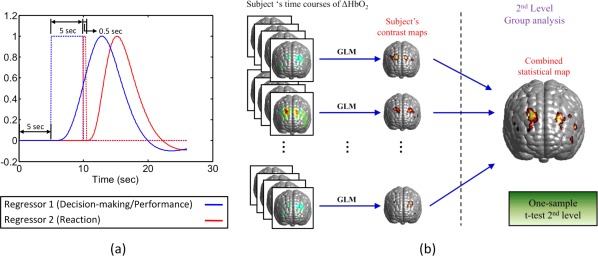
Figure 7.

Schematic illustrations of an experimental design of BART and the random‐effect analysis. (a) A schematic of protocol and regressor design of BART. The time course contains a 5‐s baseline, a 5‐s BART performance, followed by a 15‐s recovery time. The boxcar marked with blue dotted line represents the blocked design of stimulation in response to the decision‐making/performance phase; the boxcar marked with red dotted line represents the event‐related stimulation associated with the reaction phase. Blue and red curves represent the respective brain responses which were convoluted between the BART stimulation and HRF. (b) A schematic diagram of two‐stage random‐effects analysis, presented in a similar way shown in [Huettel et al., 2009]. [Color figure can be viewed in the online issue, which is available at http://wileyonlinelibrary.com.]
