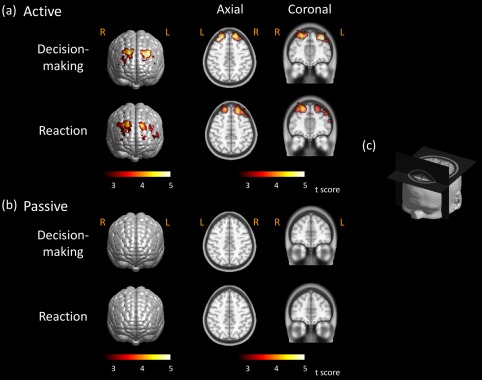
Figure 9.

Brain activation images stimulated by active and passive BART. Brain activation maps from subjects performing BART (a) in active mode and (b) in passive mode. Threshold was set as P < 0.01 (FDR corrected). Axial and coronal views of brain activations were sliced along the locations shown in (c). Color scales in figure represent the t value. Notice that “R” represents the right and “L” represents the left side of the brain. [Color figure can be viewed in the online issue, which is available at http://wileyonlinelibrary.com.]
