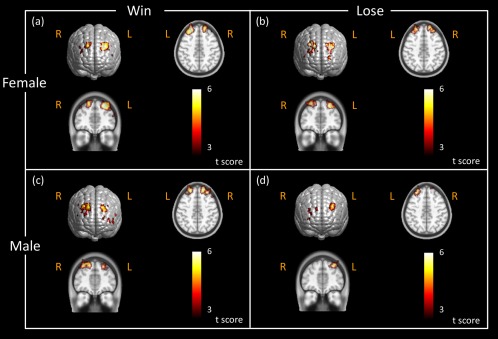
Figure 11.

Brain activation images stimulated by active BART in different genders during reaction phase. Brain activation maps were obtained in response to active BART mode when female subjects (N = 21) saw the outcome (a) in the “win” case, (b) in the “lose” case, and when male subjects (N = 16) saw the outcome (c) in the “win” case, and (d) in the “lose” case. These activation maps had the statistical threshold of FDR corrected P < 0.01. The axial and coronal views of brain activations were sliced along the locations shown in Figure 9c. Color scales in the figure represent the t value. Notice that “R” represents right and “L” represents left side of the brain. [Color figure can be viewed in the online issue, which is available at http://wileyonlinelibrary.com.]
