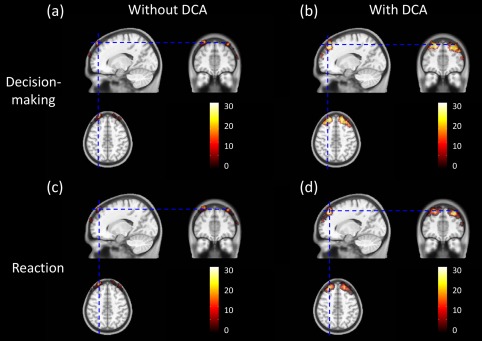
Figure 12.

Group‐level Atlas‐guided images of overlapped activation voxels across all participants. Shown are a axial, coronal, and sagittal views of brain activations across all participants during decision‐making/performance phase (a) without DCA and (b) with DCA used. Axial, coronal, and sagittal views of brain activations across all participants during reaction phase (c) without DCA and (d) with DCA used. Color scales shown represent the number of overlapping times at each voxel from all the participants. [Color figure can be viewed in the online issue, which is available at http://wileyonlinelibrary.com.]
