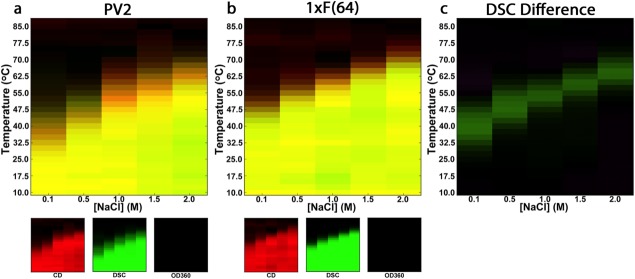
Figure 5.

Temperature vs. salt concentration empirical phase diagrams of PV2 and 1xF(64). Empirical phase diagrams were generated using CD (a measure of secondary structure formation; red color indicates native-like structure), DSC (monitors heat associated with unfolding; intensity of green color corresponds integrated DSC signal, in which green color is assigned to the pretransition signal) and OD360 (turbidity; blue color). Phase diagrams are generated with an additive color scheme; thus, yellow color indicates that both CD and DSC report native-like interactions whereas black color indicates an unfolded protein that does not aggregate. A difference DSC EPD (c) was generated by subtracting the interpolated, integrated DSC signals of PV2 from that of 1xF(64); green indicates regions where 1xF(64) has a greater population of folded molecules than PV2.
