
Figure 3.
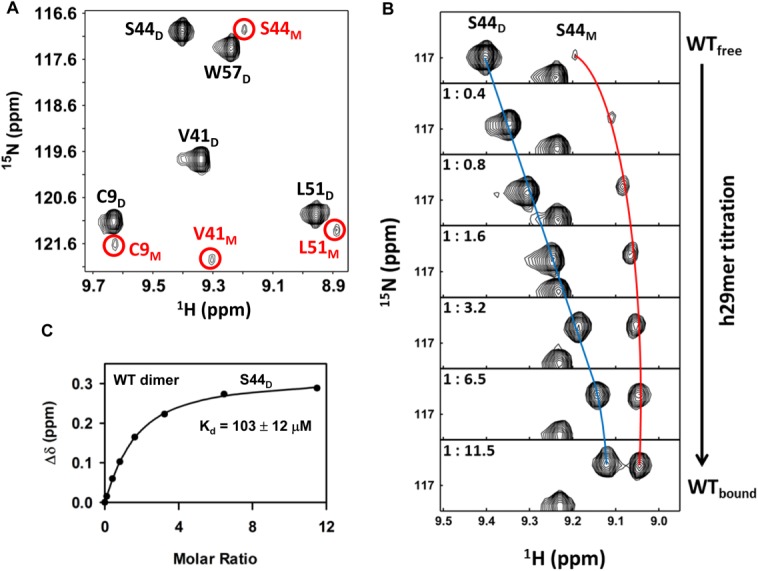
Binding of h29mer to WT CXCL8. A: A selected region of the 1H-15N HSQC spectrum showing dimer and monomer peaks (circled and labeled in red) of a 90 µM WT CXCL8 sample in 50 mM sodium phosphate buffer at pH 7.0. B: A selected region of the 1H-15N HSQC spectrum showing binding-induced chemical shift changes for the S44D (dimer) and S44M (monomer) resonances. The individual panels correspond to different points (molar ratios highlighted in the panels) over the course of the titration. The blue and red lines trace the movement of the dimer and monomer peaks. C: The apparent dissociation constant (Kd) curves obtained by fitting the binding-induced chemical shift changes for S44D resonances. Average Kd from a subset of 10–12 residues is indicated.