
Figure 6.
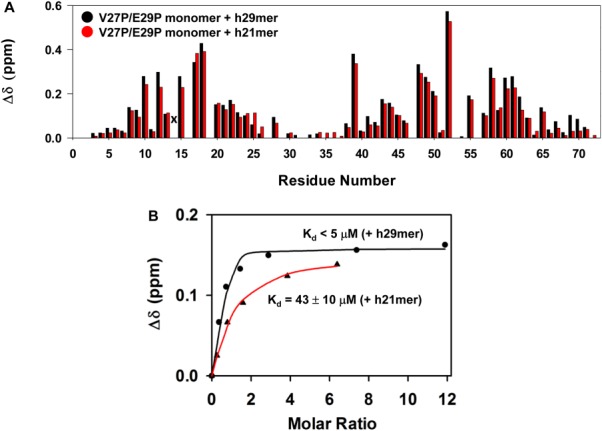
Binding of CXCL8 monomer to h29mer and h21mer. A: A histogram plot showing h29mer (black) versus h21mer (red) binding-induced chemical shift changes in the V27P/E29P monomer. Residue S14 is broadened out (indicated by x), and residues 16, 19, 32, and 53 are prolines. B: A representative plot for measuring the dissociation constant (Kd) by fitting binding-induced chemical shift changes for S44 resonance is shown. The average Kd from a subset of 10–12 residues is indicated.