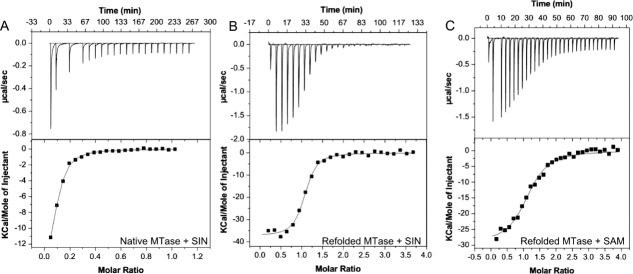
Figure 2.

ITC Analysis of SAM or SIN binding to DNV3 MTase. Heat flow versus time (upper panels) and reaction enthalpy (lower panels) at 25°C of (A) SIN injected into ITC buffer containing native DNV3 MTase, (B) SIN injected into ITC buffer containing refolded DNV3 MTase, and (C) SAM injected into ITC buffer containing refolded DNV3 MTase. The negative peaks in the upper panels represent exothermic heat of binding at each injection of SIN or SAM.
