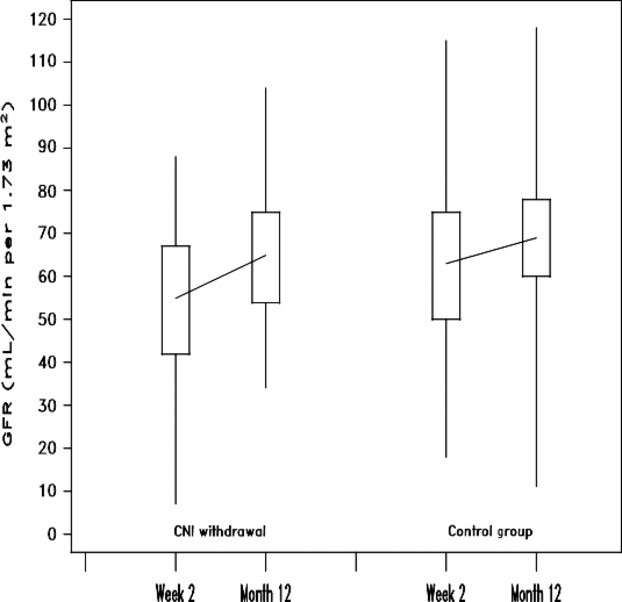
Figure 3.

Improvement in eGFR from time of randomization (week 2) to month 12: box plot of CNI withdrawal and control groups by intention to treat, showing median (line), interquartile range (box), minimum and maximum values (whiskers). Improvement in eGFR was not different between the groups: 12.8 (SD18.8) vs. 5.3 (SD19.4) ml/min/1.72 m2 for CNI withdrawal versus control, P = 0.089.
