Fig 2.

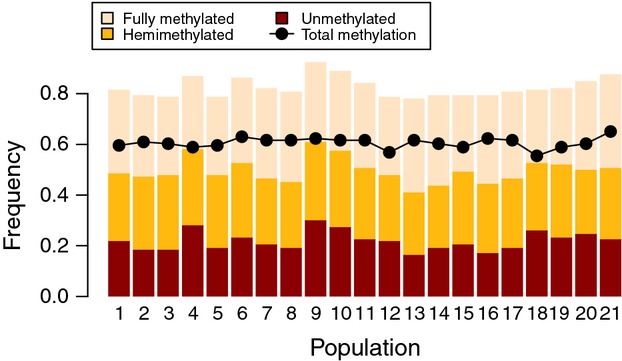
Median genome-wide methylation levels (full methylation, hemimethylation and absence of methylation) per population. Dots represent the summed frequencies of full methylation and hemimethylation.

Median genome-wide methylation levels (full methylation, hemimethylation and absence of methylation) per population. Dots represent the summed frequencies of full methylation and hemimethylation.