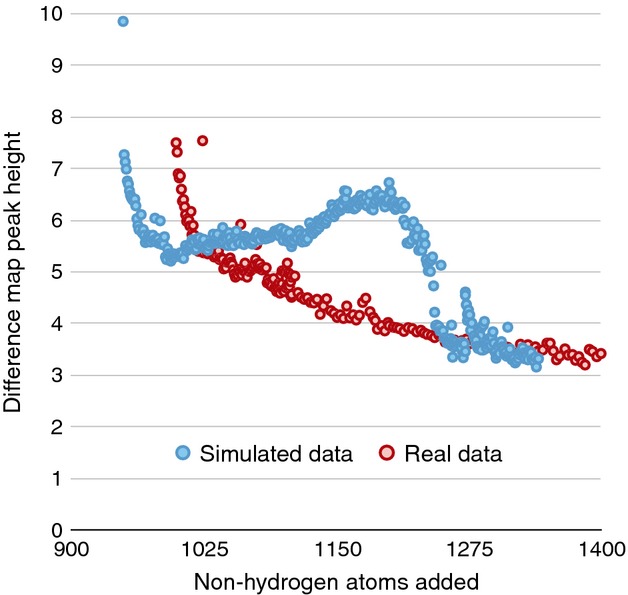
Fig 4.

Maximum residual peak height in the difference maps at each step in the autobuild procedure. The peak height of the next difference feature of the simulated data steadily increases with building cycle, behavior that is not seen with real macromolecular data.
