Figure 4.

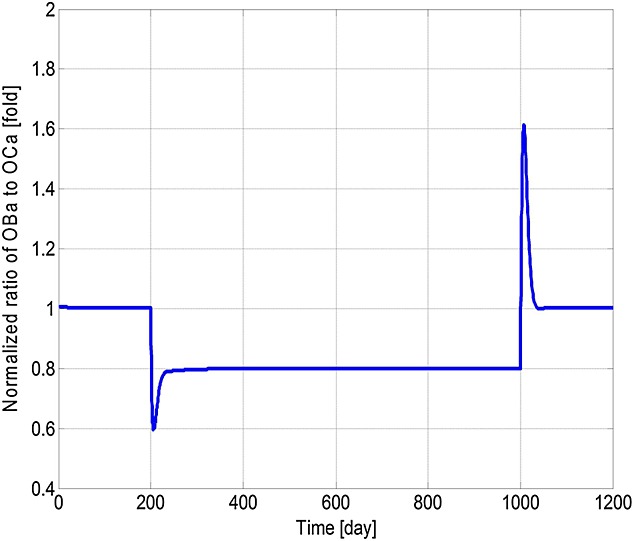
Model simulations of the variation in the normalised ratio of active osteoblasts to active osteoclasts with respect to the initial ratio (multiple myeloma cells are injected at day 201 and removed at day 1001).

Model simulations of the variation in the normalised ratio of active osteoblasts to active osteoclasts with respect to the initial ratio (multiple myeloma cells are injected at day 201 and removed at day 1001).