Figure 5.

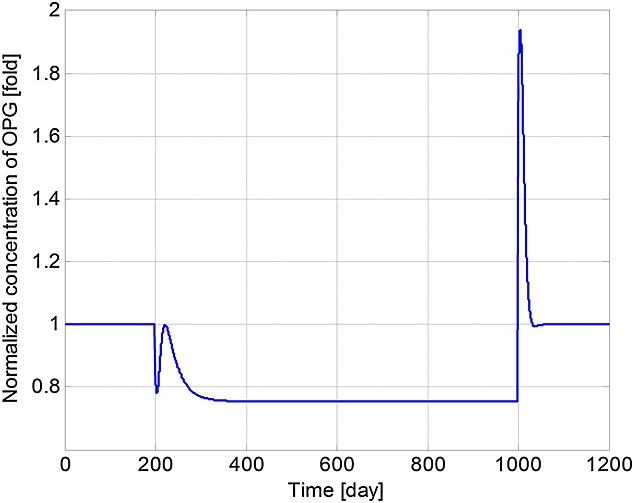
Model simulations of the variation in normalised osteoprotegerin (OPG) concentration with respect to its initial value (multiple myeloma cells are injected at day 201 and removed at day 1001).

Model simulations of the variation in normalised osteoprotegerin (OPG) concentration with respect to its initial value (multiple myeloma cells are injected at day 201 and removed at day 1001).