Figure 8.

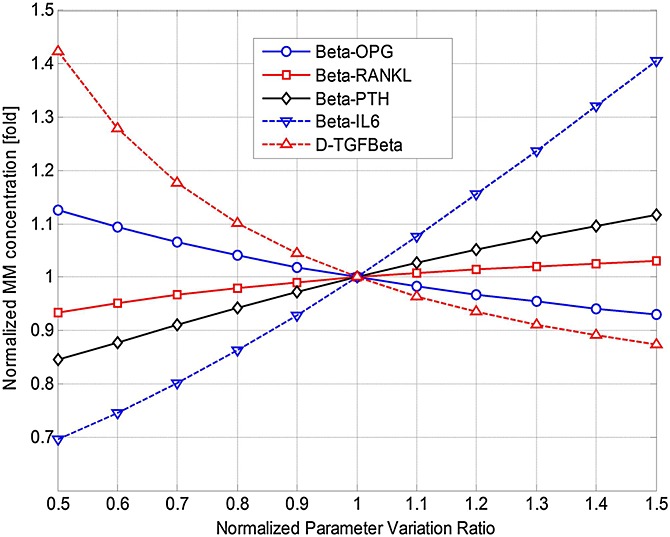
The effects of independently varying each model parameter (βOPG, βRANKL, βPTH, βIL-6 and  ) on multiple myeloma (MM) concentration at day 1000. Parameter variance and MM concentration are normalised to the values of the base case.

The effects of independently varying each model parameter (βOPG, βRANKL, βPTH, βIL-6 and  ) on multiple myeloma (MM) concentration at day 1000. Parameter variance and MM concentration are normalised to the values of the base case.