Figure A1.

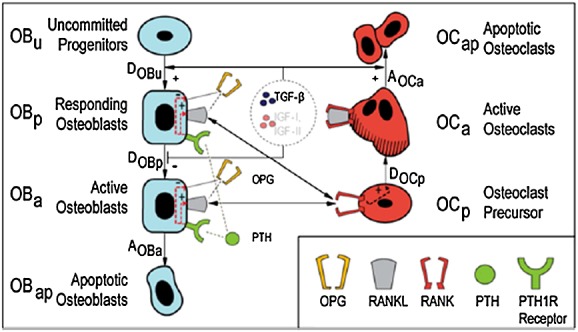
Schematic representation of the basic structure of interaction between osteoclastic and osteoblastic lineages. Reproduced from Pivonka et al. 14.

Schematic representation of the basic structure of interaction between osteoclastic and osteoblastic lineages. Reproduced from Pivonka et al. 14.