
Figure 3.
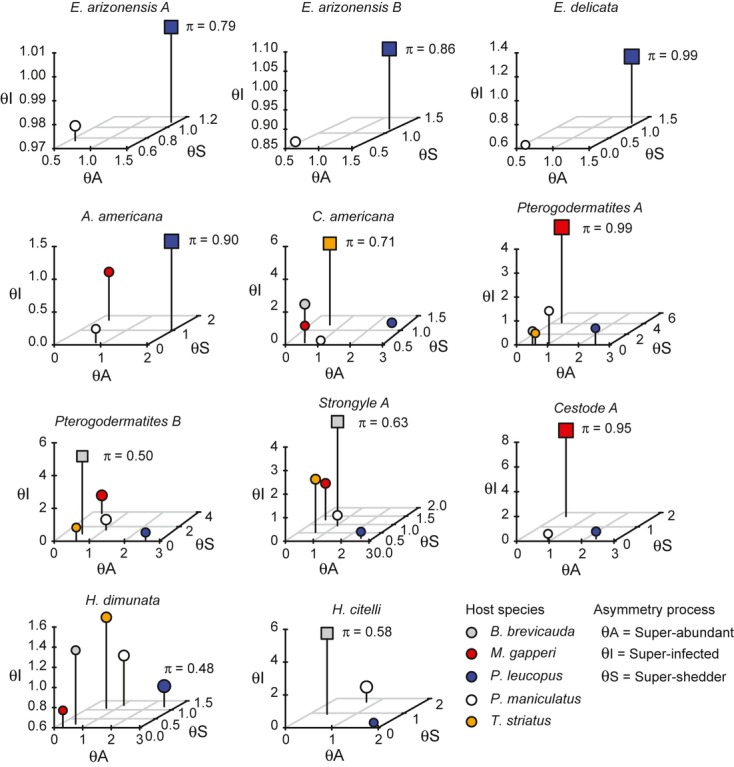
Contributions of three sources of host heterogeneity for 11 multihost parasites. Symbol sizes are proportional to the total contribution of infective stages produced by each host species. Squares indicate the key host species (πi > 0.5) for each parasite. Pairwise plots of each source of host heterogeneity are shown in Figs S3–S5.