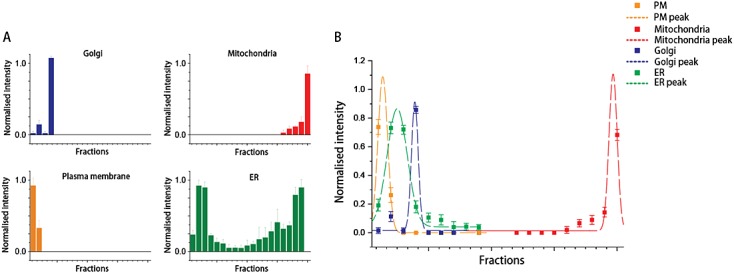
Figure 6.

Quantitative analysis of immunoblotting signals. (A) Average signal intensities for organelle markers are normalized and plotted across the entire gradient. Error bars (standard deviation, SD) indicate that the majority of fractions (even those with relatively low protein concentrations) showed a high level of reproducibility. (B) Gaussian peak fit for organelle-enriched fractions. Gaussian functions were fitted to the original data (dots with relative SDs) by using a damped least-squares (Levenberg–Marquadt) algorithm. The resulting Gaussian peaks were validated by reduced χ2 value, residual sum of squares and F value. Plasma membrane (PM), ER, Golgi and mitochondria reporters showed peaks at distinctive fractions, confirming the high degree of resolution achieved by this protocol
