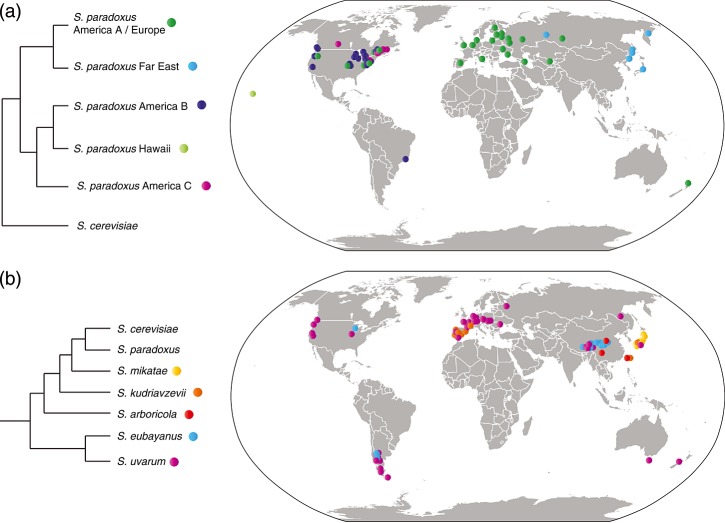
Figure 2.
Locations from which Saccharomyces yeasts have been isolated: (a) S. paradoxus populations; (b) Saccharomyces species, not including S. paradoxus and S. cerevisiae. Dots represent isolation locations and colours represent species or populations; locations are approximate; overlapping dots of different colours are offset for clarity; where the only available location data available is the name of a country, dots are placed near the country's centre (location data from National Institute of Technology and Evaluation, 2014; Zhang et al., 2010; Erny et al., 2012; Kuehne et al., 2007; Naumov et al., 1997, 2000, 2013; Liti et al., 2009; LeDucq et al., 2014; Wang and Bai, 2008; Sampaio and Gonçalves, 2008; Lopes et al., 2010; Almeida et al., 2014; Bing et al., 2014; Hyma and Fay, 2013; and papers cited therein). S. paradoxus cladogram redrawn from Liti et al. (2009) and LeDucq et al. (2014). Map graphic altered from https://en.wikipedia.org/wiki/File:BlankMap-World8.svg, accessed 13 June 2014

