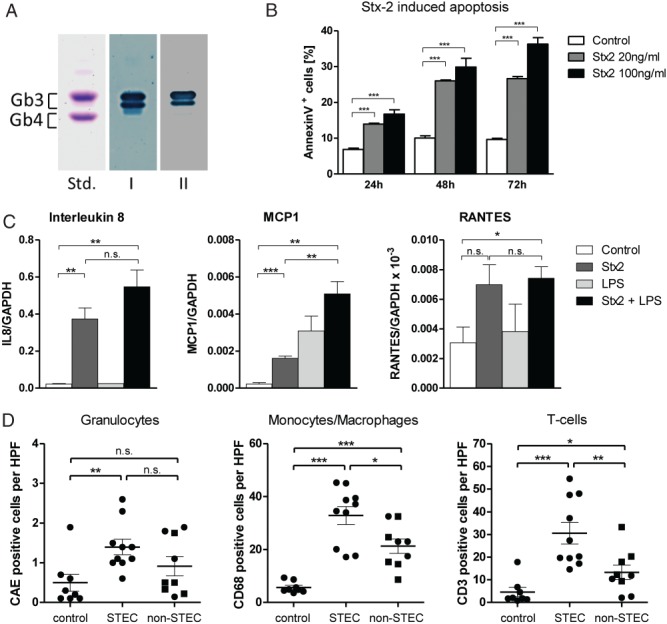
Figure 6.

Stx2 effects on human tubular epithelial cells and on interstitial inflammation. (A) Thin-layer chromatography immuno-overlay demonstrated the presence of the Stx2 receptor Gb3 on the human renal tubular epithelial cell line HK-2. Glycosphingolipid aliquots from the HK-2 cells were applied for Gb3 detection, using polyclonal anti-Gb3 antibody (lane I) and Stx2 (lane II). An equimolar mixture of Gb3 and Gb4 (10 µg), prepared from human erythrocytes, served as standard (Std); the two bands of Gb3 are due to different chain lengths of fatty acids in the ceramide portion of Gb3. (B) Apoptosis under the influence of Stx2 was investigated in HK-2 cells; these were exposed for 24, 48 and 72 h to cell culture medium alone (control) or Stx2 at 20 or 100 ng/ml. Apoptosis was measured by flow cytometry as the proportion of Annexin V-positive cells. Stx2 led to a time- and dose-dependent increase of apoptosis in HK-2 cells (n = 4). (C) Expression of selected cytokines in HK-2 cells in response to Stx2 and LPS was investigated; to this end, cells were exposed to Stx2 (100 ng/ml) and/or LPS (1 µg/ml) for 6 h and the expression of IL8, MCP1, RANTES and GAPDH was measured by quantitative RT–PCR. Whereas Stx2 increased the expression of all three cytokines, no further elevation was observed for IL8 and RANTES when the cells were also treated with LPS (n = 3). (D) The presence of granulocytes [positive for chloracetate esterase (CAE)], monocytes/macrophages (CD68-positive) and T cells (CD3-positive) was quantified in kidney biopsies of STEC-infected patients (STEC, n = 10) and compared to normal kidneys (non-tumourous parts of tumour nephrectomies, control, n = 8) and biopsies from patients with STEC-unrelated TMA (non-STEC, n = 9). Whereas the granulocytic infiltrate was elevated in both the STEC and non-STEC groups to a similar extent, a significantly higher increase was observed for monocytes/macrophages and T cells in the STEC than in the non-STEC group; in the non-STEC group, individuals > 45 years are depicted as squares. In (B, C) statistical differences were tested by two-tailed Student's t-test; in (D) two-tailed Mann–Whitney test was used: data are shown as mean ± SEM; n.s., non-significant; *p < 0.05; **p < 0.01; ***p < 0.001
