
Figure 4.
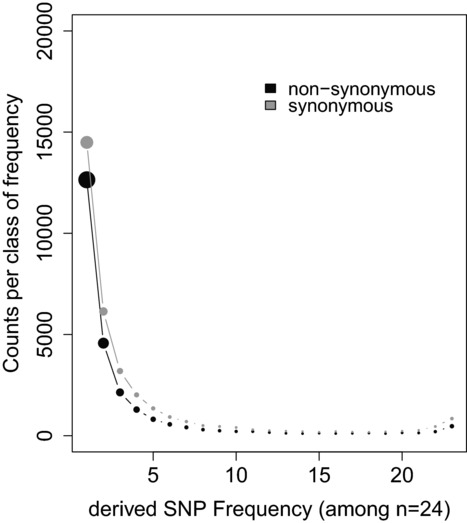
An example of site frequency spectrum (SFS) data in chimpanzee (Pan troglodytes troglodytes). Data comprising the resequencing of the exome of 12 individuals (n = 24 chromosomes) is redrawn using the data of Ref. 76. Circle size is proportional to counts of polymorphism. Synonymous counts are in gray (upper set of L-shaped dots) and nonsynonymous counts in black (lower set of L-shaped dots).