
Figure 1.
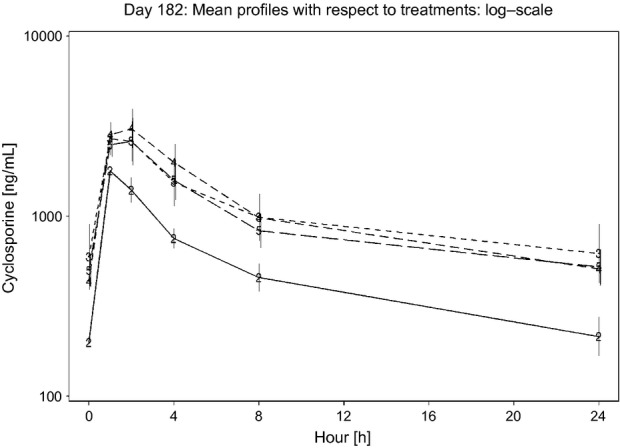
Day 182: Mean cyclosporine profiles with respect to treatment groups presented on a log scale. Treatment group 2 (8 mg/kg/day) is represented by a solid line; treatment groups 3 (16 mg/kg/day), 4 (24 mg/kg/day), and 5 (40 mg/kg/day) are represented as dotted lines. Vertical bars indicate ±SEM. Cmax and AUC were not dose-proportional.