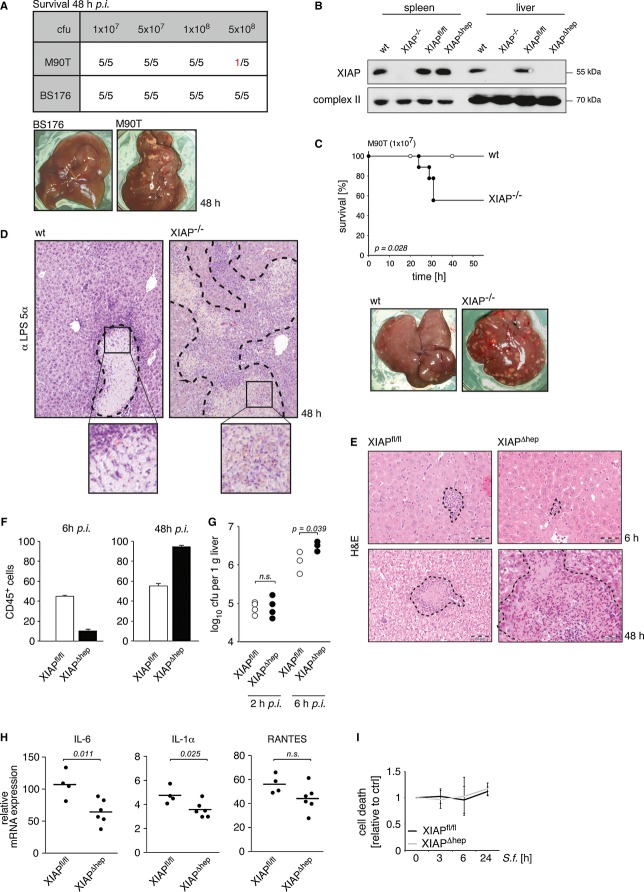
Figure 6. XIAP confers immunity against Shigella infection in vivo.
- Wt mice were i.v. infected with invasive Shigella M90T or non-invasive Shigella BS176 with the indicated cfu. Survival was monitored for 48 h. Macroscopic inspection of representative livers (5 × 10⁸ cfu, lower panel) (n = 5 in each group).
- Spleen and liver of wt, XIAP−/−, XIAPfl/fl and XIAPΔhep mice were analyzed for XIAP expression by Western blotting.
- Kaplan–Meier curve of wt and XIAP−/− mice infected with Shigella M90T (1 × 10⁷ cfu). Mice were sacrificed 48 h p.i. and livers were inspected macroscopically (wt: n = 9; XIAP−/−: n = 9).
- Liver sections from mice treated as in (C) were analyzed microscopically after staining with hematoxylin & eosin and a Shigella-specific LPS 5α-antibody.
- XIAPfl/fl and XIAPΔhep mice were infected and treated as in (C). Liver sections were analyzed microscopically at the indicated time points as in (D) (scale bar = 50 μm).
- Quantification of leukocytes (CD45+ cells) was performed independently by two experienced pathologists. Immunostained slides for CD45 were evaluated and the number of CD45+ cells was counted per square millimeter in the hepatic parenchyma, with care taken to avoid areas of necrosis. Counts were expressed as numbers per square millimeter based on twenty 40× HP-field cells.
- XIAPfl/fl and XIAPΔhep mice were infected with Shigella M90T and sacrificed at the indicated time points p.i.. Bacterial load in the liver was determined. Each point represents log10 cfu per 1 g liver per individual animal.
- XIAPfl/fl and XIAPΔhep mice were infected with Shigella M90T and sacrificed 6 h p.i.. Relative mRNA expression was determined by RT-PCR and normalized to uninfected control mice.
- Primary hepatocytes isolated from XIAPfl/fl and XIAPΔhep mice were infected with Shigella M90T (MOI 50). Cell death was measured at the indicated time points by trypan blue exclusion. Data are presented as mean ± SD (n = 3).
Source data are available online for this figure.

