Figure 7.

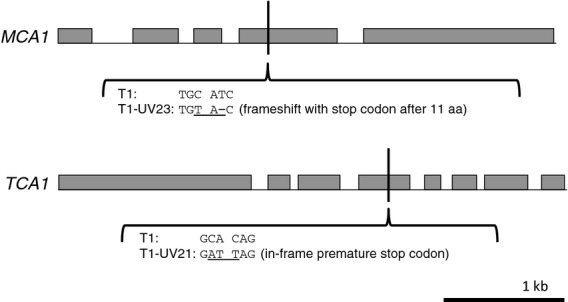
Examples of mutations recovered in the MCA1 and TCA1 genes. Exons are represented by grey boxes. The scale is shown at the bottom right; both genes are 4.1 kb.

Examples of mutations recovered in the MCA1 and TCA1 genes. Exons are represented by grey boxes. The scale is shown at the bottom right; both genes are 4.1 kb.