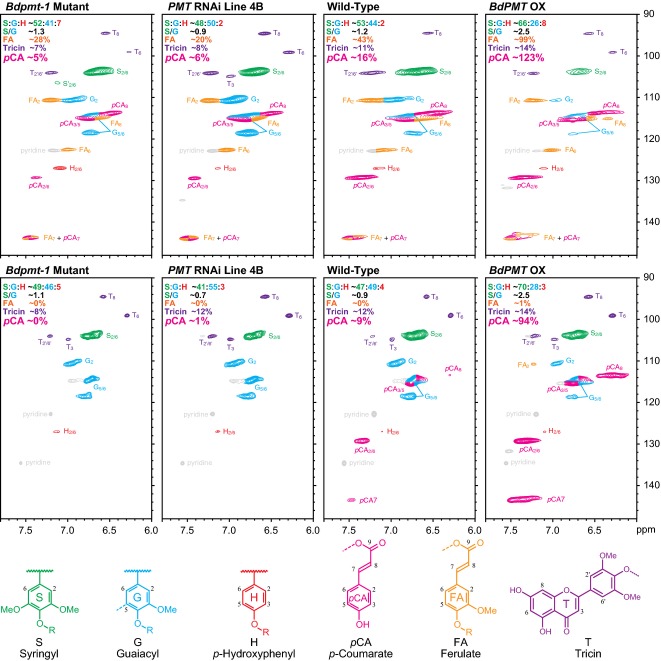
Figure 6.
Solution-state HSQC NMR of ball-milled plant cell walls (top row) and cellulolytic enzyme lignin (CEL) treatment (bottom row) in DMSO-d6/pyridine-d5.From left to right are the Bdpmt-1 mutant, BdPMT downregulated line 4B (PMT RNAi line 4B), wild-type and BdPMT overexpressed (BdPMT OX). Sample peaks have been color-coded according to the lignin substructures below the plots. The percentages and ratios reported for each spectrum are integrals relative to total H+G+S aromatic units.

