
Figure 6.
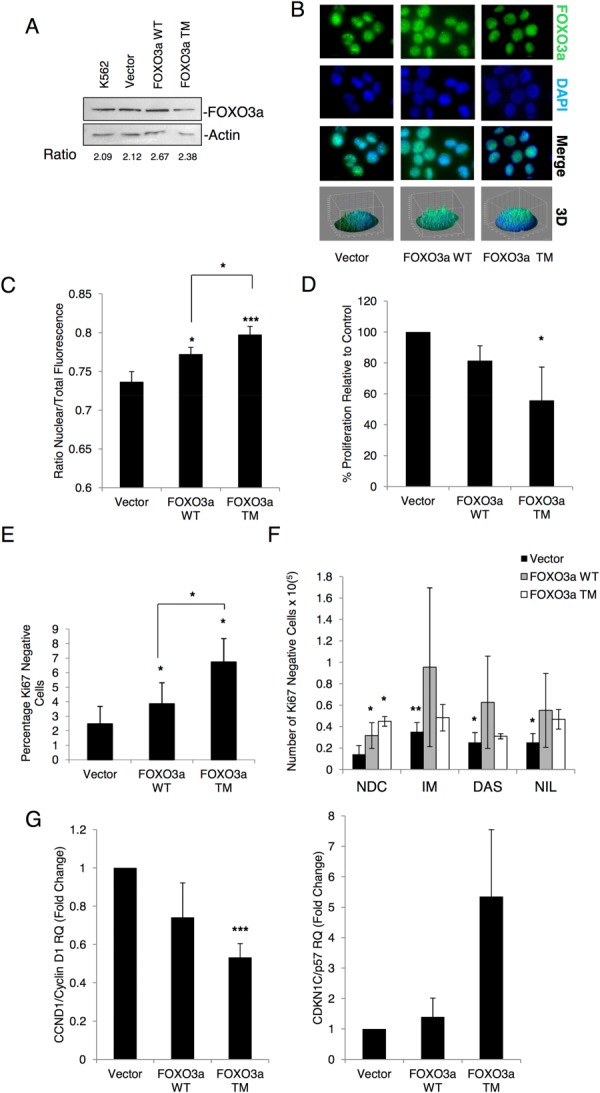
Stable transfection of a FOXO3a active mutant into K562 cells increases quiescence. K562 cells were stably transfected with FOXO3a WT, FOXO3a TM, or an empty vector control. (A): Cells were lysed in RIPA buffer and 20 µg of each were separated by SDS-PAGE, Western blotting was used to show levels of FOXO3a and Actin. Fold change relative to Actin is shown. (B): Localization of FOXO3a WT and TM was determined by IF (green: FOXO3a, blue: nuclear DAPI, ×100 magnification) and (C) quantification of nuclear to total fluorescence (n = 31–45 cells, **, p < .01, *, p ≤ .05). (D): BrdU incorporation was used to measure proliferation in stable cell lines (n = 3, *, p ≤ .05), while (E) shows the percentage of Ki67-negative cells as determined by Ki67/7-AAD staining (n = 3, *, p ≤ .05). To compare this to quiescence induced by TKIs, cell lines were treated for 72 hours with IM (1 µM), DAS (10 nM), or NIL (50 nM) before being stained for Ki67/7-AAD. (F): Shows the number of Ki67-negative cells following treatment (n = 3, **, p < .01; *, p ≤ .05 relative to vector only NDC). (G): Levels of CCND1/Cyclin D1 (left, n = 3 *, p < .001) and p57/CDKN1C (right, n = 3) mRNA were determined by quantitative PCR. Abbreviations: DAS, dasatinib; DAPI, 4′6-diamidino-2-phenylindole; IM, imatinib; NDC, no drug control; NIL, nilotinib.