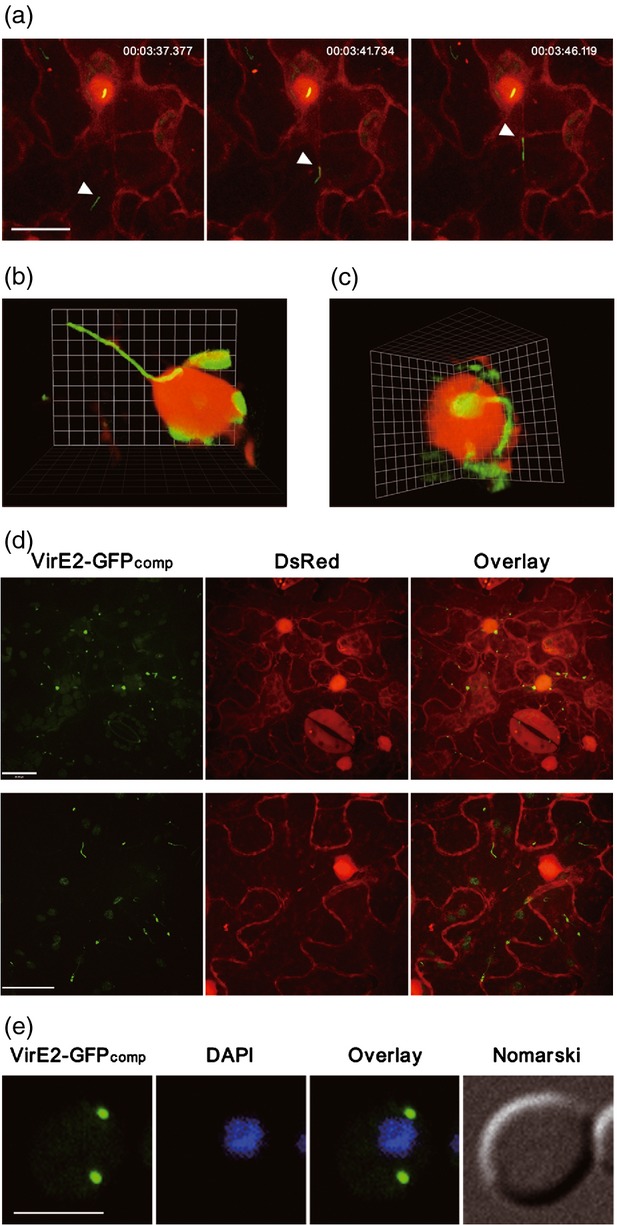
Figure 3.

Tracking of VirE2 movement inside recipient cells. (a) VirE2-GFPcomp movement inside plant cells. Agrobacterium tumefaciens EHA105virE2::GFP11 cells were infiltrated into transgenic Nicotiana benthamiana (Nb308A) leaves expressing both GFP1–10 and DsRed. The movement of VirE2-GFPcomp signal (arrowed) inside the epidermal cells was monitored at 2 days post-agroinfiltration (Movie S1). Representative pictures from the time-lapse movie (Movie S1) show the VirE2 movement; a timer is shown at the top (h:min:sec). DsRed expression facilitated the visualization of cellular locations. Scale bar: 20 μm. (b) VirE2-GFPcomp complex attached onto the nucleus. (c) Filamentous VirE2-GFPcomp complex linked to VirE2-GFPcomp inside the nucleus. (d) Mutations at NLS1 of VirE2-GFP11 abolished the nuclear localization of VirE2-GFPcomp. Two representative fields (one in the upper panel; another in the lower panel) are chosen to show the effect of the mutations. Scale bar: 20 μm. (e) VirE2-GFPcomp signal inside yeast cells. Saccharomyces cerevisiae BY4741(pQH04-GFP1–10) cells were co-cultivated with AS-induced A. tumefaciens EHA105virE2::GFP11 and observed at 24 h post co-cultivation. Scale bar: 5 μm. All images were obtained under a confocal microscope with an Olympus UPLSAPO 60 × NA 1.20 water immersion objective.
