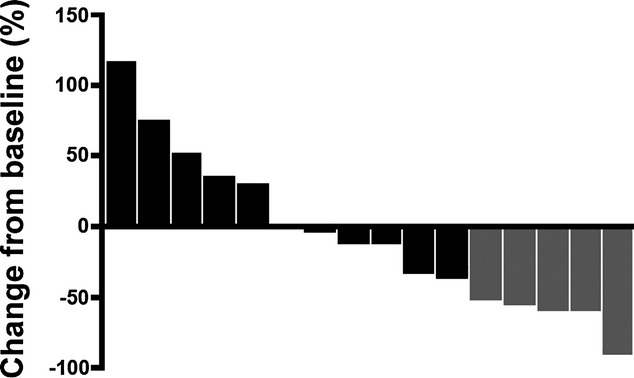
Figure 1.

Waterfall plot illustrating patient response to single-agent neo-adjuvant capecitabine. Bars represent the sum of the products of the longest perpendicular diameter of all measurable lesions. Gold bars represent patients with confirmed partial responses, whereas black bars represent patients with stable disease, no response, or progressive disease.
