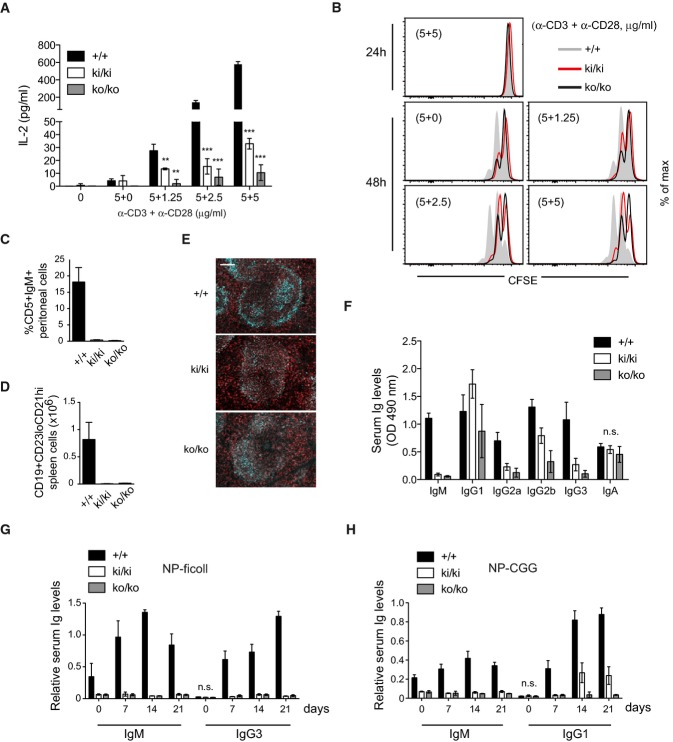
A, B IL-2 production (A) and proliferation (B) and of naïve T cells stimulated with the
indicated concentrations of plate-bound anti-CD3 and anti-CD28 antibodies (pooled from three mice
and stimulated in triplicates).
C, D Analysis of the presence of peritoneal CD5+IgM+ B1 B
cells and splenic marginal zone CD19+CD23loCD21hi B cells in
wild-type (+/+), knock-in (ki/ki), or knock-out (ko/ko) mice (n
= 3).
E Fluorescence staining of spleen sections for the presence of CD21/35+
marginal zone B cells (cyan) and IgD+ follicular B cells (red). Scale bar, 100
μm.
F Analysis of total basal immunoglobulin (Ig) levels in the serum of wild-type
(+/+), knock-in (ki/ki), or knock-out (ko/ko) mice (n =
8).
G, H NP-specific immunoglobulin (Ig) levels in the serum after immunization with NP-ficoll (G) or
NP-CGG (H) (n = 8).
Data information: Bars represent means ± SD; differences were statistically
significant with
P < 0.01 (unpaired
t-test) unless
indicated otherwise (**
P < 0.01;
***
P < 0.001; n.s., not significant). Data are
representative of four (A, B), three (C–E), or two (F–H) experiments.

