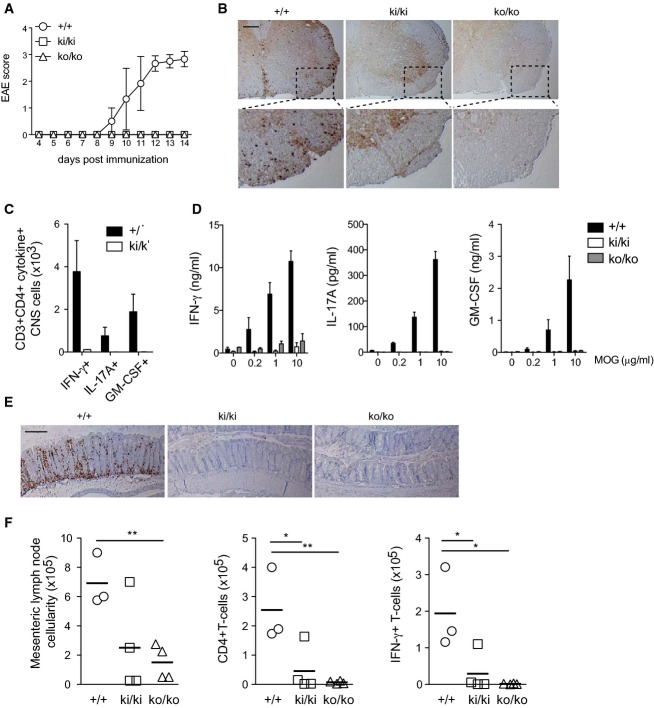
Figure 4. Inactivation of the Malt1 protease activity prevents development of autoimmune encephalomyelitis and attenuates T-cell-induced colitis.
- A Development of clinical disease in wild-type (+/+, n = 5), knock-in (ki/ki, n = 6), and knock-out (ko/ko, n = 4) mice after immunization with MOG.
- B Immunohistochemical detection of CD3+ T cells in the spinal cord of mice of the indicated genotypes at day 14 after immunization with MOG. Scale bar, 200 μm. The lower panel shows insets in higher magnification.
- C Flow cytometric analysis of CD3+CD4+ T cells expressing IFN-γ, IL-17A, or GM-CSF in the spinal cord of wild-type (+/+) and knock-in (ki/ki) mice at day 14 after immunization with MOG.
- D Analysis of cytokine production of splenic CD4+ T cells of the indicated genotypes at day 10 after immunization, restimulated in vitro with the indicated concentrations of MOG peptide and CD4-depleted splenocytes for 3 days.
- E Immunohistochemical analysis of Rag2-deficient mice 8 weeks after adoptive transfer of naïve CD4+ T cells of wild-type (+/+, n = 3), knock-in (ki/ki, n = 4), and knock-out (ko/ko, n = 4) mice, for the presence of CD3+ T cells in the colon. Scale bar, 200 μm.
- F Flow cytometric analysis of the numbers of total, CD3+CD4+ T cells, and CD3+CD4+IFN-γ+ cells in mesenteric lymph nodes of Rag2-deficient mice 8 weeks after transfer of naïve CD4+ T cells of the indicated genotypes.
Data information: Bars in (C) and (D) represent means ± SD. Each symbol in (F) represents an individual mouse, and horizontal lines represent means. *P < 0.05; **P < 0.005 (unpaired t-test). Data are representative of three (A, B) and two (C–F) independent experiments.

